
They Mined 1.5 Million Tonnes. They Never Found The Bottom.
Past-producer credentials — Cominco, approximately 1.5 Mt at 2.88% Cu, mined 1962–68. Every modern phase has extended the system: open at depth, along strike, and on the western flank.
Three phases drilled — every one has extended the system. Phase 3 is underway and a resource estimate is in progress.
Wedge production figures are historical. See Technical Notes.
— Gary Lohman, B.Sc., P.Geo., VP Exploration & Director
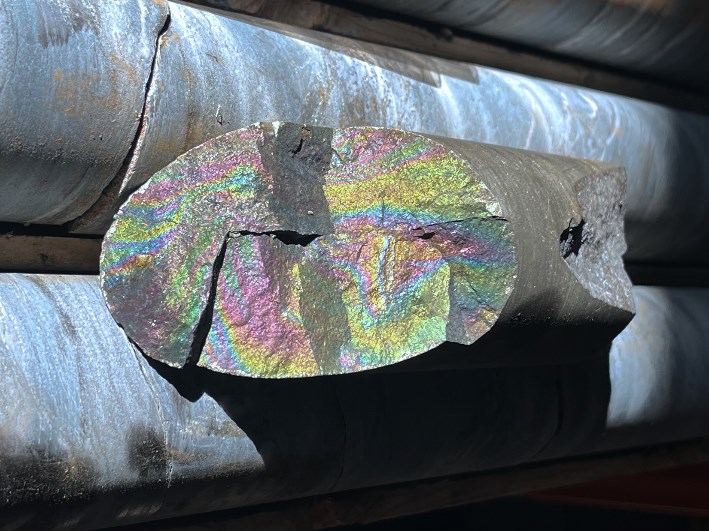
FIGURE 2: Copper Bloom Core Sample — DDH WD-24-07 · 1.65% Cu-Eq over 40.32 m · news release May 16, 2024
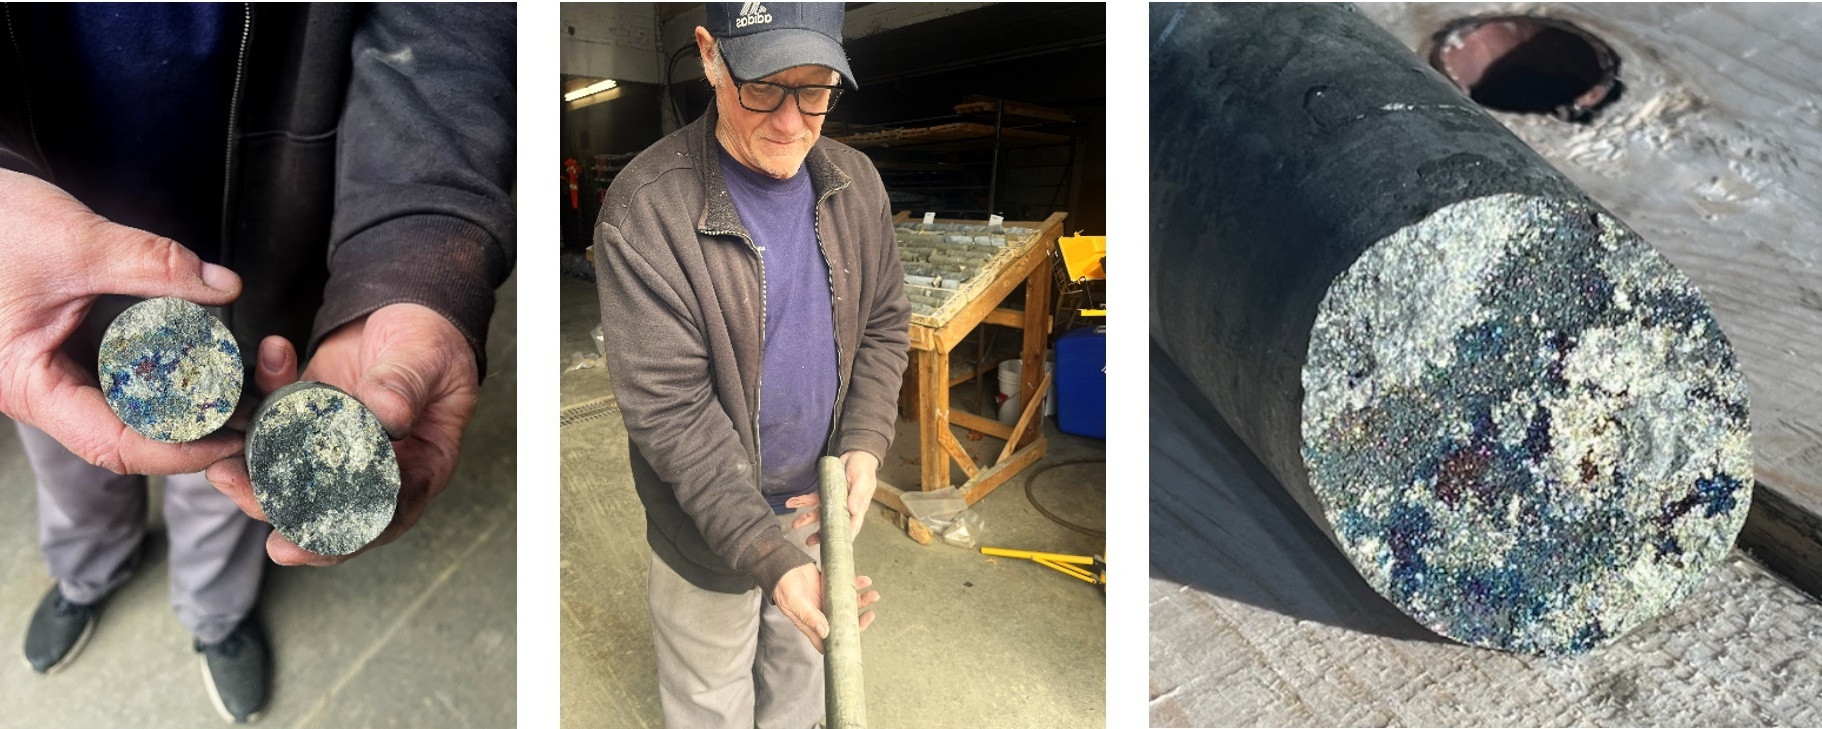
FIGURE 1: Visible Massive Copper Mineralization from Zone 1 & 2 (including Covellite (CuS) & Bornite (Cu₅FeS₄)) — DDH WD-25-02 · news release December 3, 2025
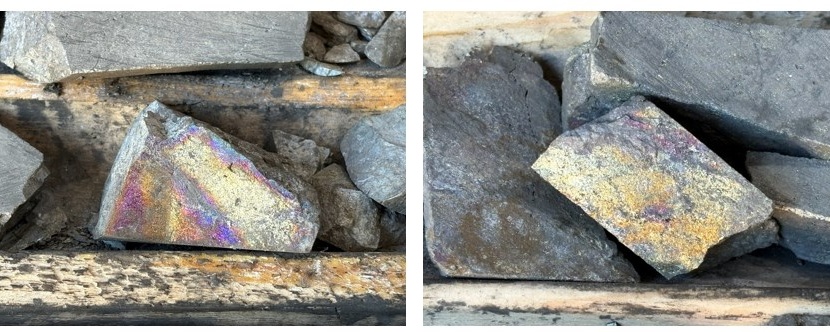
FIGURE 1: Bornite copper samples #396431 (left) and #396432 (right) — DDH WD-26-09 · 3.49% Cu-Eq over 24.55 m, true width · news release August 12, 2026
| Hole | Cu % | Pb % | Zn % | Ag g/t | Au g/t | CuEq % |
|---|---|---|---|---|---|---|
| Phase 1 · WD-24-07 · 40.32m | 1.20 | 0.18 | 0.88 | 8.00 | 0.12 | 1.65 |
| Phase 2 · WD-25-02 · 32.10m | 1.53 | 0.47 | 1.81 | 14.09 | 0.35 | 2.78 |
| Phase 3 · WD-26-07 · 24.00m | 1.88 | 0.55 | 1.09 | 17.10 | 0.26 | 2.77 |
Historic production tonnages and grades sourced to McCutcheon, S.R. and Walker, J.A. (2020), Geoscience Canada, v.47(3), Table 1, published by the Geological Association of Canada. Nine Mile results are drill intersections, not deposit grades, and are not directly comparable to the mined deposits above. Copper equivalent values are calculated on the metal prices and recovery assumptions disclosed in each result’s news release and differ between holes; they are not directly comparable. See Technical Notes and the Company’s filings on SEDAR+.
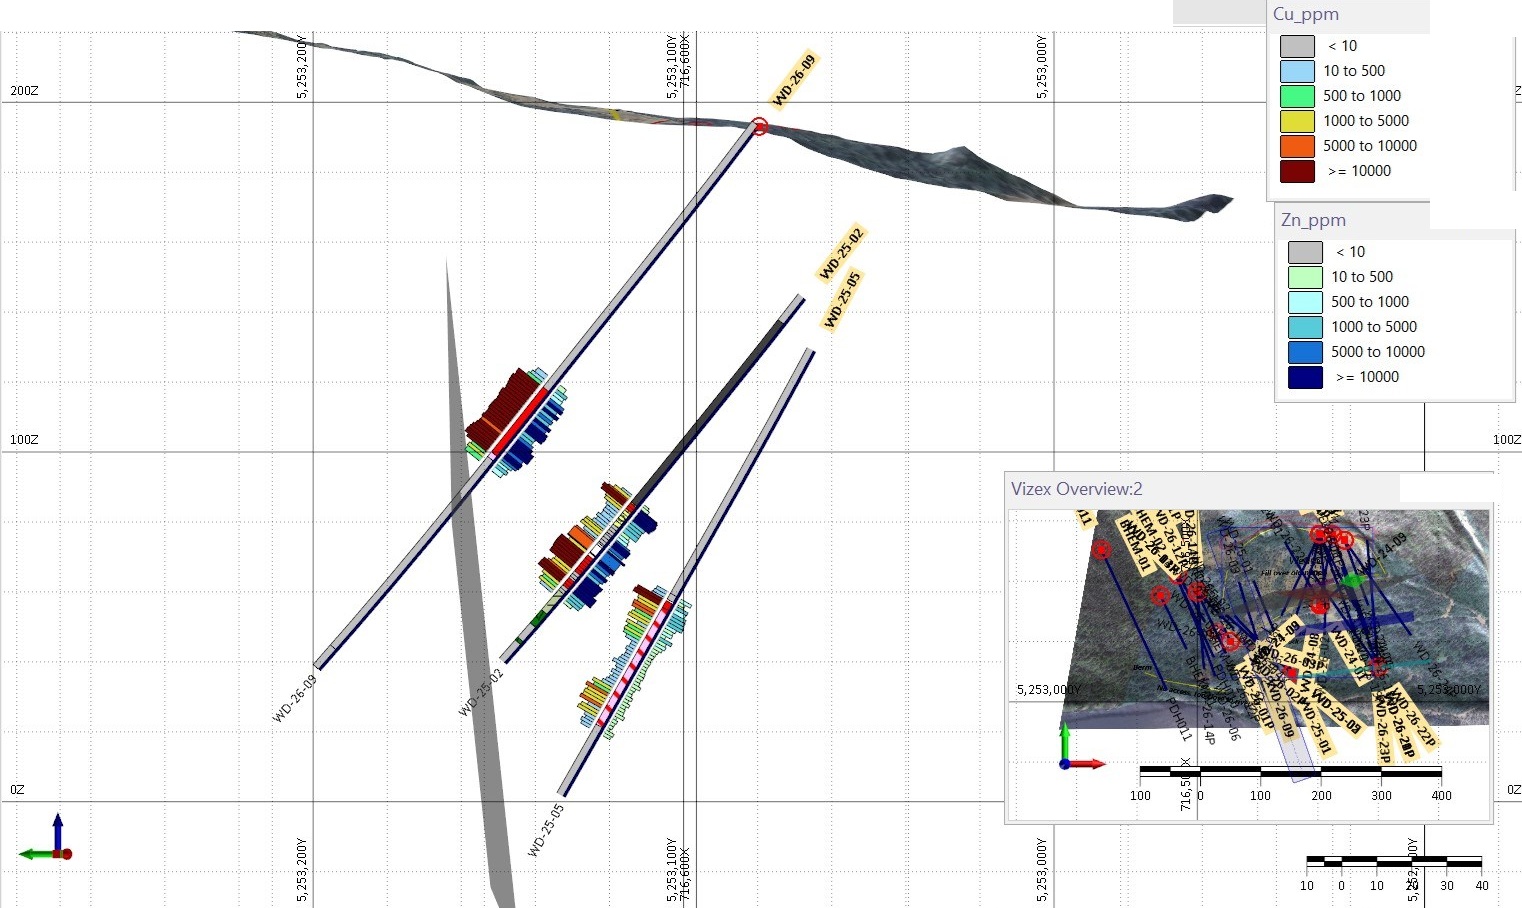
Apex Geoscience cross section — DDH WD-26-09 with WD-25-02 and WD-25-05, copper and zinc grades down hole · news release August 12, 2026 · vertical exaggeration 20×
Increase the mineralized footprint and improve the economics.
WD-25-2B ended in 4.47% Cu; the hole stopped, the mineralization didn’t
The expectation is that 60%+ of the deposit remains untouched, based on recent drill testing and 3D modelling
Testing six priority targets on the same trend beyond the historic mine, including the West Wedge and Tribag targets.
Targets shown are conceptual and are not mineral resources. No mineral resource has been estimated on any Company property. See Technical Notes.
Junior Mining Hub is the ultimate destination for all Junior Mining News and information.
WD-26-09 and WD-26-10 intervals are reported as true widths. All other widths are drilled core lengths and true widths are not yet known. Certified assay results and visual estimates from core logging are identified separately wherever they appear. Assays for the remaining Phase 3 holes are pending at ALS Global.
Copper equivalent values are for comparison only and are not directly comparable between holes; each is calculated on the metal prices and recovery assumptions disclosed in its own news release, which differ by release.
| Hole / Group | Pricing Date | Source | Recovery |
|---|---|---|---|
| 2024 Wedge holes | 13 May 2024 | — | 80% |
| WD-25-02 | 13 February 2026 | — | 80% |
| Nine Mile Brook bulk sample | 27 February 2026 | — | 80% |
| WD-25-2B | 1 April 2026 | — | 80% |
| WD-26-09 | 11 August 2026 | Bloomberg | 95% |
| WD-26-07 | 15 August 2026 | Bloomberg | 95% |
| WD-26-10 | 26 August 2026 | Kitco | 95% |
Cominco production figures for the Wedge — approximately 1.5 Mt at 2.88% Cu, mined 1962–1968 — are historical, are sourced to McCutcheon et al. (2005), predate National Instrument 43-101, have not been verified by a Qualified Person, and are not current mineral resources or mineral reserves. Historic camp production tonnages and grades are sourced to McCutcheon, S.R. and Walker, J.A. (2020), Geoscience Canada, v.47(3), Table 1, published by the Geological Association of Canada.
No mineral resource or mineral reserve has been estimated on any Nine Mile Metals property to date. A mineral resource estimate for the Wedge is in progress; there is no assurance that it will be completed or that it will support a mineral resource. Geophysical targets shown are conceptual, are derived from modelling, and are not mineral resources.
Samples are analyzed by ALS Global, Moncton, New Brunswick, an accredited laboratory independent of the Company. Base metals by ME-ICP61a four-acid digestion with ICP-AES; gold by fire assay Au-AA23 with AA finish; overlimit gold by gravimetric analysis and overlimit base metals by OG62. ALS runs its own QA/QC protocols including coarse and pulp duplicates. The Company inserts certified reference materials, duplicates and blanks with review of all results; QA/QC and data validation were performed and no material errors were observed.
The scientific and technical information in this presentation has been reviewed and approved by Gary Lohman, B.Sc., P.Geo., VP Exploration and Director, the Company’s Qualified Person under National Instrument 43-101. Mr. Lohman is not independent of the Company. The Qualified Person has verified the data underlying the technical information in this presentation, including sampling, analytical and test data.
References to the Bathurst Mining Camp as the third largest VMS camp in the world are based on published district tonnage comparisons, which rank the camp third at approximately 250 Mt. Source: Barrie, C.T. and Hannington, M.D., Classification of Volcanic-Associated Massive Sulfide Deposits Based on Host-Rock Composition, Reviews in Economic Geology. That comparison excludes districts in China and the former Soviet Union.
Get notified about the latest company news and updates by signing up below.